
A 2025 Nature Food study used ISO 14067 carbon-footprint accounting to compare Canadian rapeseed/canola, non-durum wheat and peas with production in Australia, France, Germany and the United States.
Soil carbon and field N₂O drove much of the difference
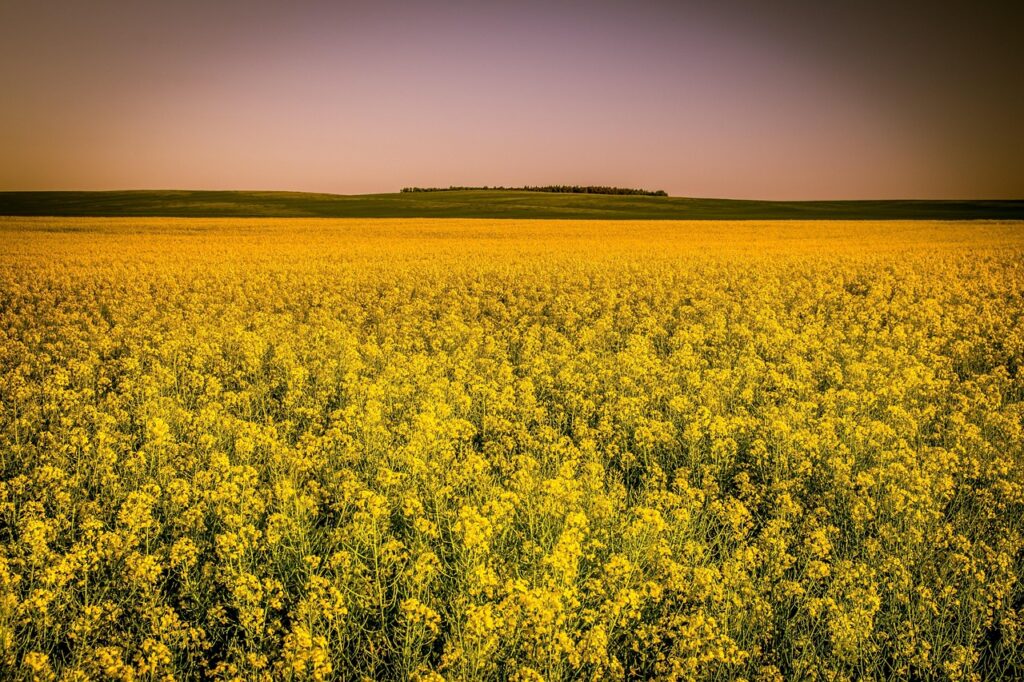
Field-level nitrous oxide emissions and soil-organic-carbon (SOC) change were the largest drivers of many country differences. With SOC included in the current accounting, the Canadian crops had lower footprints than the comparison countries; even without SOC, Canada remained lower in most comparisons, with Australian rapeseed an important exception.
Including SOC reduced the reported Canadian wheat footprint by 62% and pea footprint by 87%. Canadian peas were estimated at 0.03 kgCO₂e/kg versus 0.64 in France and 1.05 in Germany.
In extreme comparisons, transport could be repeated 17 additional times before break-even

The production difference was sometimes large enough that Canadian crops shipped overseas still remained below the destination-country footprint. For German peas and canola, the study calculated an extreme break-even example equivalent to shipping the Canadian crop to Europe 17 additional times.
This does not mean transport is irrelevant: transport contributed 21–88% of the footprint of Canadian crops delivered overseas in the modeled cases.
Supplementary data were corrected in March 2026
On 24 March 2026, the Supplementary Information was updated to correct Canadian field-level N₂O, SOC-change and related GHG and sensitivity values. The current corrected supplementary files should therefore be used. The current article still reports the central conclusions that Canadian crops generally had lower footprints, with N₂O and SOC as major drivers and some large transport break-even distances.
Country averages are not product-level guarantees
The analysis relies on country-level inventories and assumptions. Individual farms, years, soils, yields, fertilizer regimes and tillage systems can differ substantially, and SOC sequestration is not an indefinitely constant credit. The useful lesson is not ‘Canadian is always greener’ or ‘local is bad,’ but that production systems can matter more than distance alone.
For related context, see When Does Tree Planting Stop Cooling the Climate? Albedo Accounting Across 172 Carbon-Market Projects.
For related context, see Seaweed Feed Is Not One Technology: Separate Antimicrobial Extracts from Asparagopsis Methane Mitigation.
For related context, see Where Alternative Proteins Stand in 2026: Comparing Plant-Based, Microbial, Insect and Cultivated Meat.
Reference
- Bamber N, Turner I, Pelletier N. Rapeseed, wheat and peas grown in Canada have considerably lower carbon footprints than those from major international competitors. Nature Food. 2025;6:757–761. https://doi.org/10.1038/s43016-025-01212-0 (Supplementary Information updated 24 March 2026)


Comments