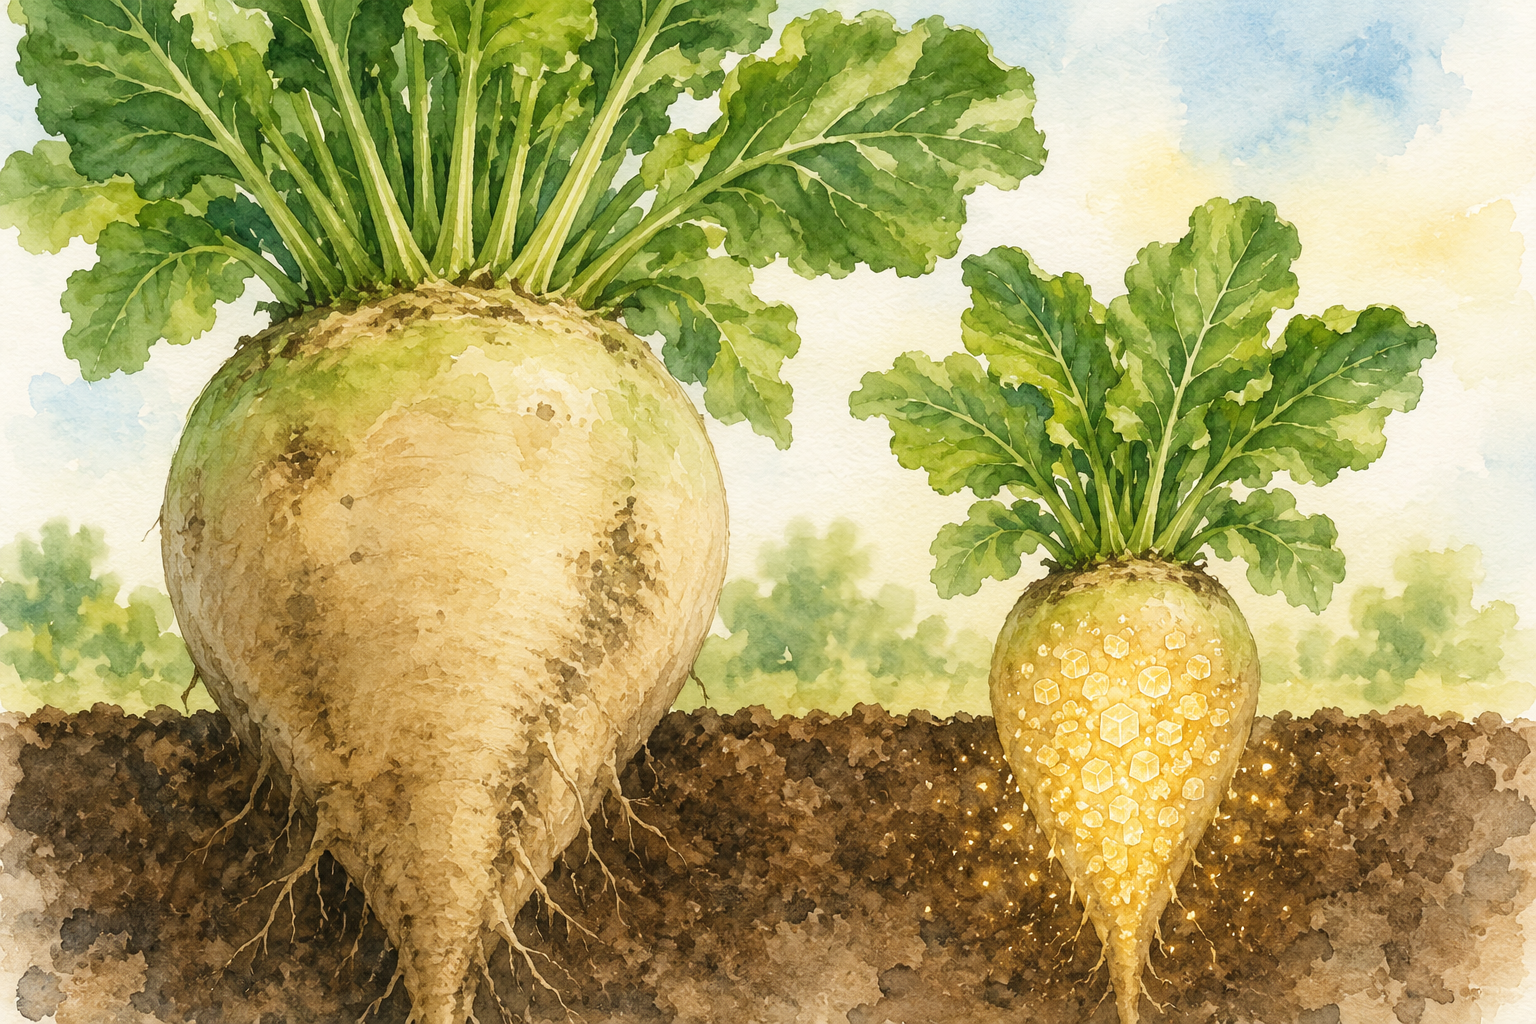
If we want a crop with more sugar, the obvious idea is to make the plant synthesize more sugar.
Increase the activity of sucrose-synthesis enzymes, and the final sugar concentration should rise. Intuitively, that makes sense.
A study published in Frontiers in Plant Science on September 1, 2026, however, produced a rather different picture in sugar beet (Beta vulgaris).
The lower-sugar line often showed stronger expression of sucrose-synthesis genes.
So what distinguished the high-sugar line?
The answer that emerges from the data is not simply a greater capacity to make sucrose, but a shift in how carbon is allocated during maturation: less carbon appears to remain committed to respiration, nitrogen metabolism, and continued root growth, leaving more carbon available for storage.
Bai and colleagues compared two inbred lines with contrasting sugar concentration and root yield. They sampled roots at approximately 83, 103, 123, 143, and 163 days after emergence—five developmental stages—and combined transcriptomic and metabolomic analyses.
That alone makes the study interesting. But if we go one step further and recalculate the reported yield numbers, another point appears: the paper is framed around a yield–sugar trade-off, yet the trade-off looks different when we estimate sucrose per hectare rather than root mass alone.
- Two contrasting lines selected from 31 genotypes
- Figure 6 tells most of the story
- The high-sugar line did not show stronger sucrose-synthesis expression
- D appears to keep using carbon for growth
- Is high sugar really about “using less” rather than “making more”?
- But the study did not directly measure metabolic flux
- Now recalculate the yield
- The two-year averages point in the same direction
- Does that mean K is industrially superior?
- The idea that growth competes with sugar storage is not new
- What is new is the time series plus two omics layers
- “Reduce metabolism and sugar will rise” is still too simple
- A major known player, BvTST2.1, was not directly tested
- The five transcription factors are candidates, not proven switches
- The metabolomics also needs cautious interpretation
- The real breeding target may be timing, not simply lower metabolism
- Can high sugar and high yield really not coexist?
- Conclusion
- Original paper
- Related studies
Two contrasting lines selected from 31 genotypes
The study focused on two inbred sugar beet lines, S72-8 and DR41K, referred to as K and D in the paper.
Across field evaluations in 2023 and 2024, S72-8 had the higher sugar concentration, averaging 15.50%, whereas DR41K averaged 12.45%. Mean root yield was 91.0 t/ha for S72-8 and 97.2 t/ha for DR41K.
The contrast was clearer in the 2024 experiment used for the omics analyses.
| 2024 | High-sugar S72-8 (K) | High-yield DR41K (D) |
|---|---|---|
| Root yield | 116.7 t/ha | 137.5 t/ha |
| Sugar concentration | 17.99% | 14.84% |
| Root yield × sugar concentration* | ~21.0 t/ha | ~20.4 t/ha |
*This is a simple estimate obtained by multiplying root yield by the polarimetry-based sugar concentration. It is not the same as recoverable white sugar yield at a factory.
D clearly produced more root biomass. K clearly contained more sugar. The authors therefore used them as a high-sugar/low-yield versus low-sugar/high-yield contrast.
Figure 6 tells most of the story
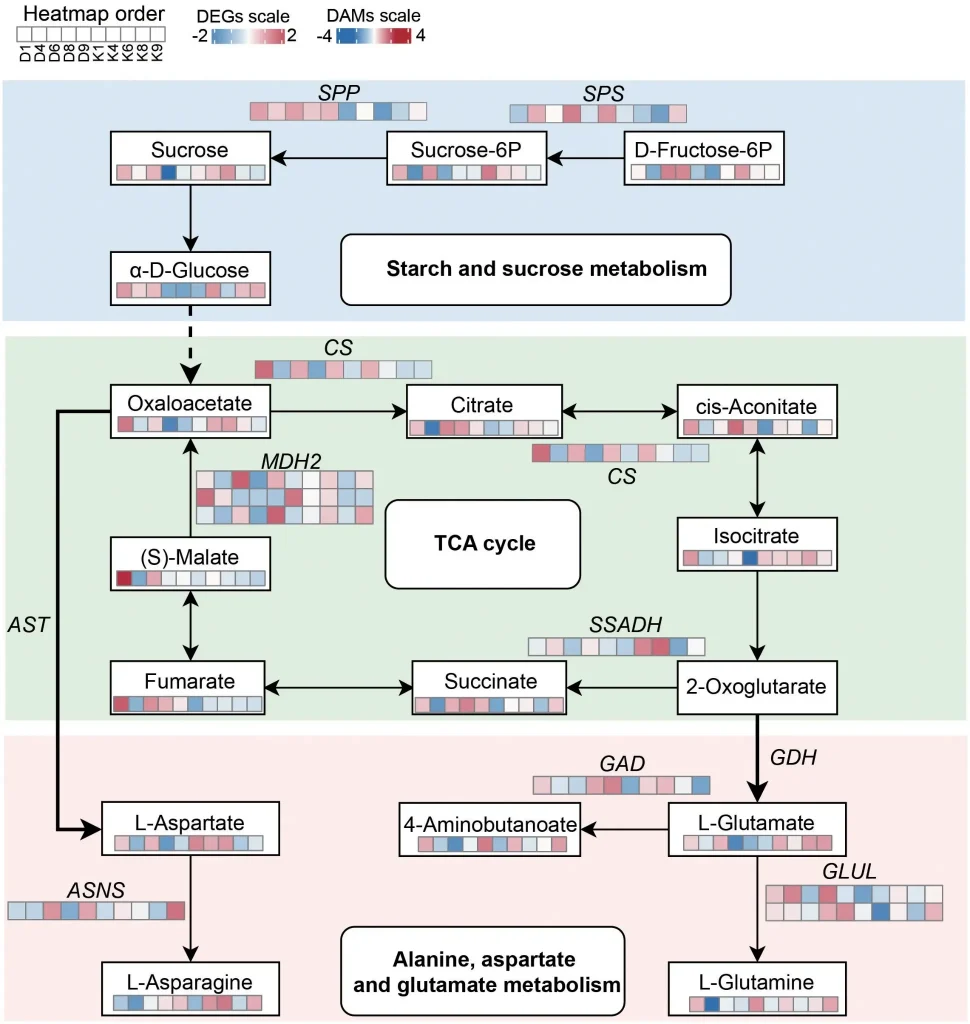
Figure 6 is the most useful figure for understanding the paper.
From top to bottom it connects sucrose metabolism → the TCA cycle → amino-acid and nitrogen metabolism.
The small heatmap cells represent the five developmental stages in D followed by the five stages in K. Red indicates relatively higher transcript or metabolite abundance; blue indicates lower abundance.
There is no need to memorize every gene name. The main question is simpler:
Does incoming carbon remain as stored sugar, or does it continue to be consumed by metabolism and growth?
The high-sugar line did not show stronger sucrose-synthesis expression
The most counterintuitive result is at the top of the figure.
Two central enzymes in sucrose synthesis are sucrose-phosphate synthase (SPS) and sucrose-phosphate phosphatase (SPP).
Yet SPP expression was consistently higher in the lower-sugar D line than in the high-sugar K line. The paper reports SPP expression of roughly 28.73–34.09 FPKM in D versus 6.50–24.76 in K. SPS also showed relatively strong expression in D at middle to later stages.
In other words,
high sugar concentration was not simply associated with continuously stronger expression of sucrose-synthesis genes.
If anything, the low-sugar line looked more active at the level of sucrose-synthesis machinery.
So where was that carbon going?
D appears to keep using carbon for growth
The middle of Figure 6 shows the TCA cycle, the central respiratory pathway that supplies ATP and carbon skeletons for biosynthesis.
In D, genes including CS, ACLY, and MDH2 showed relatively high expression. In the lower part of the figure, genes involved in nitrogen and amino-acid metabolism, including GLUL and GAD, were also more active in D. Metabolites such as citrate, malate, and glutamine were higher at several stages as well.
A simplified interpretation is:
sugar → respiration/TCA cycle → carbon skeletons and amino acids → continued root growth
This route appears to remain comparatively active in D as the root matures.
K, in contrast, shows a relative decline in these growth-associated primary metabolic pathways later in development.
Put very simply:
D behaves more like a root that is still growing. K behaves more like a root that is shifting toward storage.
Is high sugar really about “using less” rather than “making more”?
This is the central idea of the paper.
K did not achieve high sugar by simply turning sucrose synthesis up to a much higher level.
Instead, as maturation progressed, pathways that consume carbon for respiration, nitrogen assimilation, and growth became relatively weaker.
That would reduce the pull of carbon away from storage and allow a larger fraction of imported sucrose to remain in the storage pool.
As an analogy, the mechanism looks less like opening the tap wider and more like narrowing the drain.
That is an interesting way to think about source–sink relations in a storage crop.
But the study did not directly measure metabolic flux
This is an important limitation.
The paper repeatedly discusses “carbon flux” and “metabolic flux,” interpreting D as having greater flux through growth-related metabolism and K as having lower flux.
However, the core measurements were RNA abundance and steady-state metabolite abundance.
The authors did not perform isotope-based metabolic flux analysis with, for example, ^13C tracers. They also did not directly measure respiration rate or the activities of key enzymes such as CS or MDH.
So the safest interpretation is not:
“the study proved that TCA flux is higher in D,”
but rather:
“D shows a transcript and metabolite pattern consistent with greater carbon use through the TCA cycle and nitrogen metabolism.”
That distinction matters if we are discussing mechanism rather than correlation.
Now recalculate the yield
This is where the paper becomes even more interesting.
The authors describe S72-8 as high-sugar/low-yield and DR41K as low-sugar/high-yield.
That is correct if “yield” means root biomass: 137.5 t/ha for D versus 116.7 t/ha for K in 2024.
But sugar beet is cultivated primarily for sucrose, not for root mass itself.
If we simply multiply root yield by sugar concentration:
S72-8: 116.7 × 0.1799 = 20.99 t/ha
DR41K: 137.5 × 0.1484 = 20.41 t/ha
The supposedly “low-yield” high-sugar K line is actually about 2.9% higher by this crude sucrose-per-hectare estimate.
So, based on this simple calculation, the study does not show that higher sugar concentration necessarily reduced sucrose production per hectare.
What it clearly shows is a trade-off between root biomass and sugar concentration.
That is not automatically the same as a trade-off in sugar produced per unit land area.
The two-year averages point in the same direction
We can make the same rough calculation from the reported 2023–2024 mean values.
S72-8: 91.0 t/ha × 15.50% = 14.11 t/ha
DR41K: 97.2 t/ha × 12.45% = 12.10 t/ha
By this simple product, K is about 16.6% higher.
But this must not be overinterpreted. These are products of two reported mean traits, not plot-level sugar-yield measurements followed by statistical testing.
We therefore cannot conclude that S72-8 had a statistically significant advantage in sugar yield.
Still, it is an important reminder that the label “low-yield” can be misleading when the economically relevant product is sugar rather than root biomass.
Does that mean K is industrially superior?
Not necessarily.
Sugar concentration alone does not determine how much refined sugar a factory can recover from beet roots.
Potassium, sodium, alpha-amino nitrogen, and other non-sugar compounds influence molasses formation and sugar recovery. Commercial quality assessments therefore consider recoverable white sugar rather than sucrose concentration alone.
The 2026 study did not measure these processing-quality variables.
So the 21.0 versus 20.4 t/ha values above should be regarded as crude theoretical sucrose contents, not recoverable white sugar yields.
That distinction is important. In fact, measuring these additional quality traits would be the next step needed to decide which line is truly better from an industrial perspective.
The idea that growth competes with sugar storage is not new
The novelty of this study should also be framed carefully.
A 2017 transcriptome study had already compared high-yield/low-sugar and high-sugar sugar beet genotypes over time. It discussed faster root growth, dilution, and sucrose consumption for growth as possible explanations for lower sugar concentration in the high-yield genotype.
In 2020, Jammer and colleagues analyzed sugar beet root development in physiological stages—prestorage, transition, and secondary growth/sucrose accumulation—and measured enzyme activities associated with changing sugar metabolism.
And in 2015, BvTST2.1 was identified as a major tonoplast sugar transporter involved in sucrose accumulation in sugar beet taproots.
So the statement “growth and sugar storage compete” is not a 2026 discovery.
What is new is the time series plus two omics layers
The strength of the new paper is the integrated design.
Two contrasting genotypes were followed across five developmental stages, producing 30 RNA-seq libraries. The same developmental series was analyzed by metabolomics, with 568 metabolites detected.
This allowed the authors to show a coordinated pattern in which the high-sugar line becomes less growth-oriented at later stages, with transcript and metabolite data pointing in the same general direction.
The value is therefore not a single “sugar gene,” but a developmental view of how a storage organ may shift from a growth-dominated sink to a storage-dominated sink.
“Reduce metabolism and sugar will rise” is still too simple
It would also be a mistake to summarize the result as “shut down metabolism to accumulate sugar.”
Previous sugar beet studies show that sucrose-accumulating roots remain metabolically active. A functioning sink still needs energy, transport, membrane maintenance, and biosynthesis.
A better interpretation is that K reduces the relative allocation of carbon toward continued growth-associated primary metabolism and shifts the balance toward storage.
That is very different from metabolic shutdown.
A major known player, BvTST2.1, was not directly tested
There is another important gap.
BvTST2.1 is already known as a major tonoplast sugar transporter that contributes to sucrose accumulation in sugar beet storage roots.
The new study did not directly compare BvTST2.1 expression or transport activity between K and D. The authors themselves note this as a limitation. Trehalose-6-phosphate and related sugar-signaling pathways were also not directly analyzed.
So K might combine:
lower carbon consumption
with
greater vacuolar sucrose transport or retention.
The present data cannot separate these possibilities.
The five transcription factors are candidates, not proven switches
WGCNA identified five hub transcription factors associated with the high-sugar module: AP2, bHLH78, REM16, SRS3, and TIFY4b.
These are interesting candidates.
But WGCNA reveals co-expression relationships, not causal control.
There were no knockout or overexpression experiments, and direct target genes were not established. qRT-PCR confirmed consistency with RNA-seq expression patterns, but that validates the expression measurements—not the biological function of the transcription factors.
For now, they are best described as candidate regulatory switches associated with the high-sugar state.
The metabolomics also needs cautious interpretation
The study detected 568 metabolites. Differentially accumulated metabolites were defined using VIP ≥ 1 and a t-test threshold of p < 0.05.
The RNA-seq analysis applied FDR correction, but the metabolite selection criteria described in the paper do not clearly state an equivalent multiple-testing correction.
In addition, sucrose and trehalose themselves were not consistently classified as differential metabolites across all stages, whereas raffinose and galactinol showed differences at specific stages.
The final sugar-concentration difference measured by polarimetry is clear. But the metabolomics is strongest when interpreted as a coherent pathway-level pattern involving TCA intermediates and amino acids, rather than as proof that one metabolite alone drives the phenotype.
The real breeding target may be timing, not simply lower metabolism
If we think about breeding or genome editing, the most interesting implication is probably not “reduce CS or MDH.”
Early and mid-stage root growth requires carbon and energy for cell division, cell expansion, vascular development, and nitrogen assimilation.
If growth-associated metabolism were suppressed too early, the plant might fail to build a sufficiently large storage organ in the first place.
A more attractive target would be developmental timing:
grow strongly first, build root biomass, and only then switch carbon allocation from growth toward storage.
Seen this way, the hub transcription factors identified by WGCNA may be more interesting as candidate regulators of a growth-to-storage transition than as direct “sugar genes.”
Can high sugar and high yield really not coexist?
A negative relationship between root yield and sugar concentration has long been recognized in sugar beet.
But this study also shows why it is important not to evaluate those traits in isolation.
What ultimately matters is how much recoverable sugar can be produced per hectare.
In 2024, K lost to D in root biomass but did not lose in our crude estimate of total sucrose per hectare.
That raises a more interesting breeding question:
What if a plant could retain D-like root growth for longer, then switch into a K-like storage program at the right time?
That may be the most valuable idea to take away from the study.
Conclusion
If this paper is presented as “five genes that determine high sugar in sugar beet,” it is not especially convincing. The candidate regulators have not yet been functionally validated, and metabolic flux was not directly measured.
But if we read it as a study of when a plant stops using carbon for growth and starts prioritizing storage, it becomes much more interesting.
The high-sugar line did not simply show stronger sucrose-synthesis machinery. Instead, later development was associated with a relative reduction in growth-related TCA and nitrogen metabolism, consistent with leaving more carbon in the storage pool.
And once we recalculate the reported yield numbers, the “low-yield” high-sugar line is not obviously inferior in theoretical sucrose per hectare.
High sugar may therefore be less about making more carbon and more about when the plant stops spending it on growth.
Sugar beet provides a particularly clear system in which to ask that question.
Original paper
Bai X. et al. (2026). Integrated transcriptomic and metabolomic analyses reveal the molecular mechanisms of sugar accumulation and yield trade-off in sugar beet. Frontiers in Plant Science 17:1874591. DOI: https://doi.org/10.3389/fpls.2026.1874591
The article is published under CC BY 4.0. Figure 6 is reproduced here with attribution and license information.
Related studies
- Bellin D. et al. (2017). The sugar beet high-yielding genotype has a different transcriptional response to sugar accumulation than the high-sugar genotype. PLOS ONE. https://doi.org/10.1371/journal.pone.0175454
- Jammer A. et al. (2020). Enzymes of sucrose metabolism and their regulation in sugar beet root development. Plant Direct. https://doi.org/10.1002/pld3.221
- Jung B. et al. (2015). Identification of the transporter responsible for sucrose accumulation in sugar beet taproots. Nature Plants 1:14001. https://doi.org/10.1038/nplants.2014.1


Comments