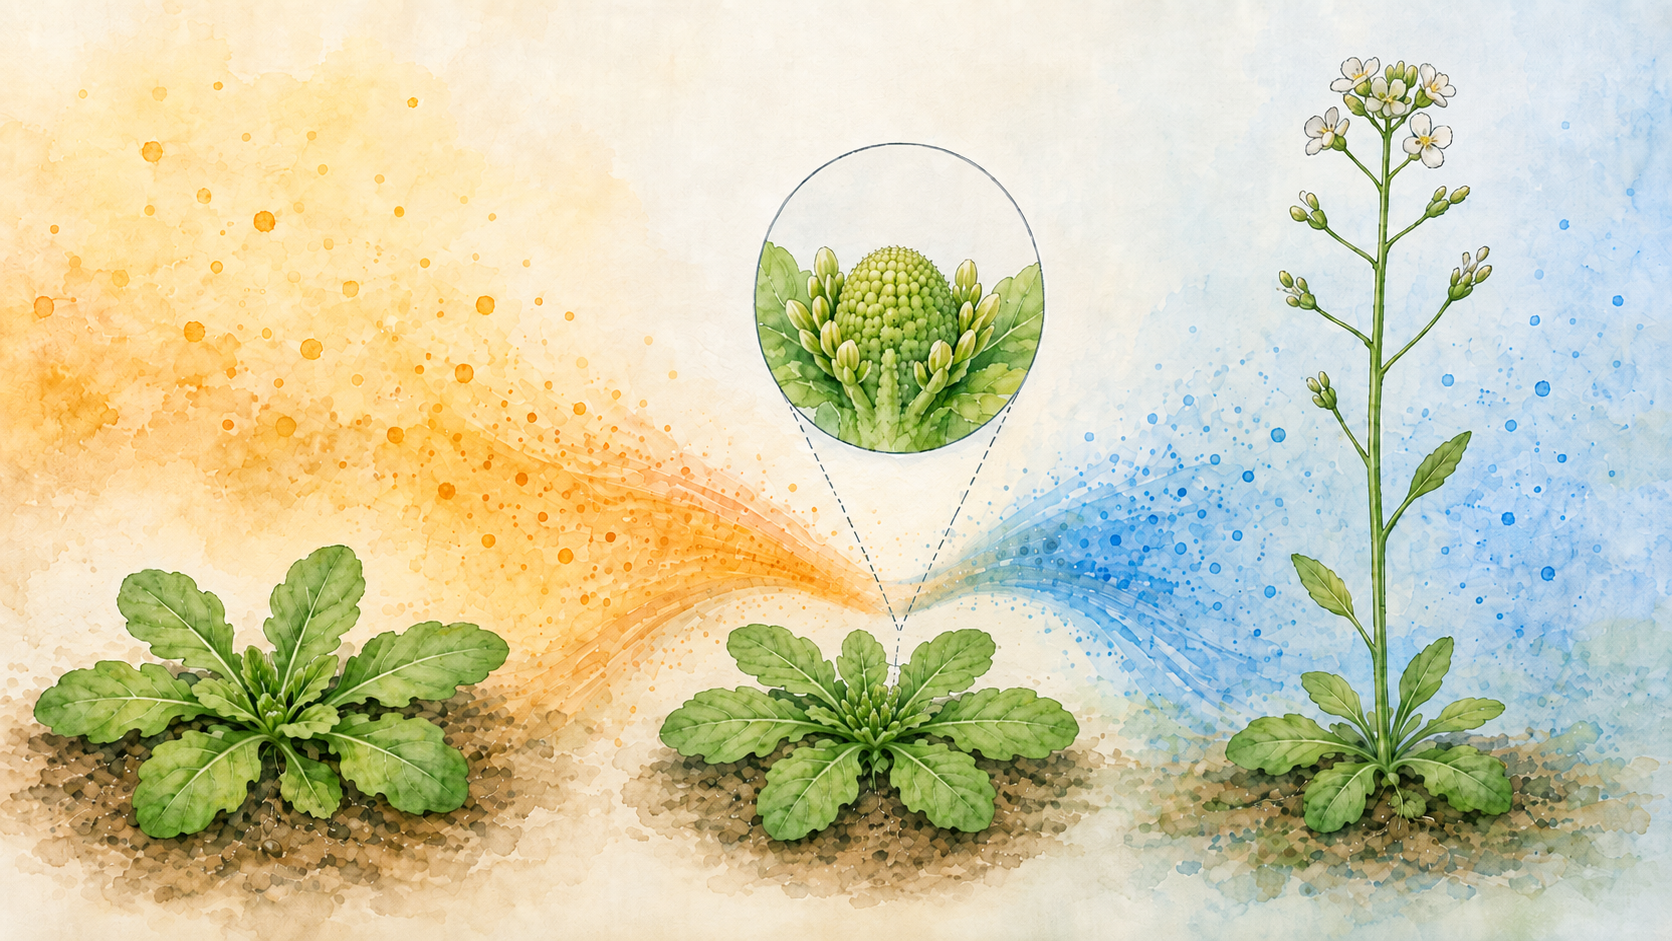
What happens at the shoot apex when a plant stops making leaves and begins making flowers?
A study published in Nature Communications on August 25, 2026, approaches floral transition in Arabidopsis thaliana not as a simple genetic ON/OFF event, but as a time-dependent transition between dynamical states.
By quantitatively tracking the floral inhibitor APETALA2 (AP2) and the floral activator SOC1 in the shoot apical meristem (SAM), the researchers found that AP2 did not simply decline smoothly.
It followed a striking pattern:
fast decline → slower decline → fast decline again.
This temporary slowdown is consistent with critical slowing down, a dynamical phenomenon expected when a bistable system passes close to a critical point. In late-flowering mutants, the slow phase itself became longer.
Flowering research has identified many regulators, including FT, SOC1, FUL and AP2. The distinctive contribution of this study is that it asks a different question: not only which genes control flowering, but how quickly a developmental system moves from one stable state to another.
- Flowering means changing the state of the shoot apical meristem
- AP2 decreases while SOC1 increases at the meristem
- Quantification reveals a fast–slow–fast decline
- Why does the transition slow down? Critical slowing down
- The ghost attractor—the afterimage of a vanished state
- Weakening floral activators makes AP2 persist longer
- In soc1, AP2 stalls from 17 to 21LD
- Stronger perturbations reveal fluctuations in AP2
- The transition is spatial as well as temporal
- What was observed, what is model-supported, and what remains unproven
- “Making a flower” and “deciding what the flower contains” are different switches
- From lists of genes to developmental state transitions
- References
Flowering means changing the state of the shoot apical meristem
The above-ground organs of Arabidopsis originate from the shoot apical meristem.
During vegetative growth, the SAM mainly produces leaves. During floral transition, it shifts into an inflorescence state and begins to generate floral primordia on its flanks.
The study focused largely on long-day conditions—16 h light and 8 h dark—which promote flowering in Arabidopsis. Under inductive long days, FT is produced in leaves and moves to the SAM, where it helps activate floral-promoting genes such as SOC1 and FUL.
During the vegetative phase, AP2 and AP2-LIKE transcription factors act on the opposite side of the network and repress flowering.
The authors reduced this complex regulatory system to a minimal dynamical model in which AP2 represents the inhibitory side and SOC1/FUL the activating side. AP2 represses SOC1/FUL, and SOC1/FUL repress AP2, forming a mutual-inhibition toggle switch.
An age-related variable, S, represents the combined influence of ageing signals including SPL activity and, to some extent, MIR172.
AP2 decreases while SOC1 increases at the meristem
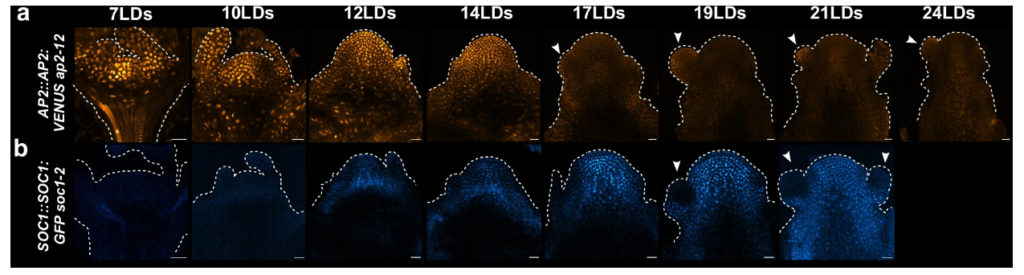
The researchers used AP2::AP2:VENUS and SOC1::SOC1:GFP fluorescent reporters to follow protein abundance in the SAM over time.
LDs indicate the number of days under long-day conditions. At 7LD, AP2 signal is strong whereas SOC1 is barely detectable. As development proceeds, AP2 decreases and SOC1 rises. By around 17LD, SOC1 is near its maximum and mature floral primordia begin to become visible on the sides of the meristem.
The simplest way to read the images is to follow the exchange between orange AP2 and blue SOC1.
Quantification reveals a fast–slow–fast decline
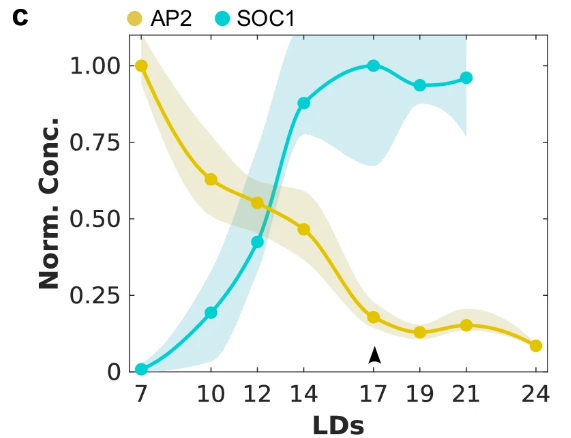
When fluorescence was quantified, AP2 did not show a simple monotonic decay with a constant rate.
Between 7 and 10LD, AP2 declined rapidly. Between 10 and 14LD, the decline became markedly slower. Then, between 14 and 17LD, AP2 decreased strongly again.
In other words, the trajectory was fast–slow–fast.
Around 14LD, leaf primordium formation ceases on the SAM flanks, the meristem continues to elongate, and cauline leaves can be detected. Floral primordia become visible later, around 17LD.
The slowdown therefore occurs during a biologically meaningful intermediate period rather than simply reflecting random measurement noise.
The model comparison is important. In the authors’ parameter exploration, a monostable transition could produce a progressively slower inhibitor decline, but it could not reproduce the subsequent re-acceleration. The fast–slow–fast behavior emerged in the bistable-transition scenario.
This does not mean that bistability has been proven in the strongest possible experimental sense. Rather, the measured dynamics and model comparison provide strong support for time-dependent bistability during floral transition.
Why does the transition slow down? Critical slowing down
A useful intuitive picture comes from the Waddington landscape.
Imagine one valley representing the vegetative state and another representing the inflorescence state. Early in development, the vegetative valley is stable. As photoperiod and age-related signals change, the landscape itself changes over time.
Eventually, the vegetative stable state can collide with an unstable state and disappear in a saddle-node bifurcation. Once that happens, the system can no longer remain in its former stable state.
But the disappearance of an attractor does not necessarily mean an immediate, rapid jump to the new state.
Near the former attractor, the dynamical landscape becomes relatively flat, so motion can become transiently slow. This additional timescale near criticality is the essence of critical slowing down in the model used here.
The ghost attractor—the afterimage of a vanished state
The authors describe the slow transient using the concept of a ghost attractor.
The former stable state has already disappeared, but its dynamical influence remains temporarily as slow motion through the region where that fixed point used to exist.
Calling it the “ghost of the old state” is a useful metaphor, but nothing material is literally left behind. It is a property of the dynamical vector field after the fixed point has vanished.
In this model, the ghost attractor accounts for the temporary plateau in AP2 decline and therefore introduces an additional delay before floral primordium formation.
Weakening floral activators makes AP2 persist longer
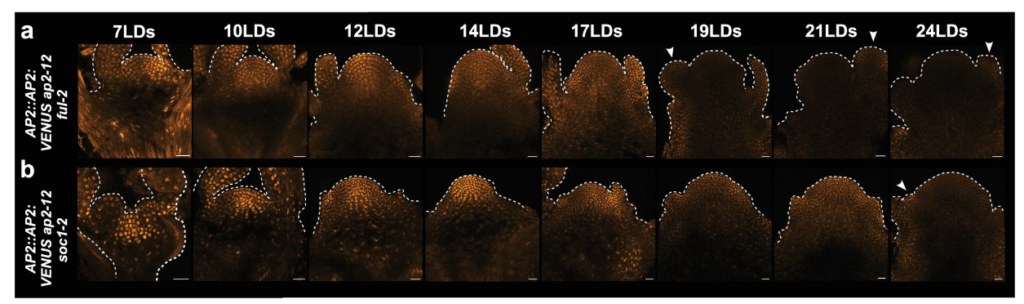
The genetic tests strengthened this interpretation.
FUL and SOC1 are floral activators. In @@INLINE0@@ and @@INLINE1@@ mutants, AP2 fluorescence remained in the SAM longer than in the wild-type-like trajectory.
The effect was especially pronounced in soc1.
In soc1, AP2 stalls from 17 to 21LD
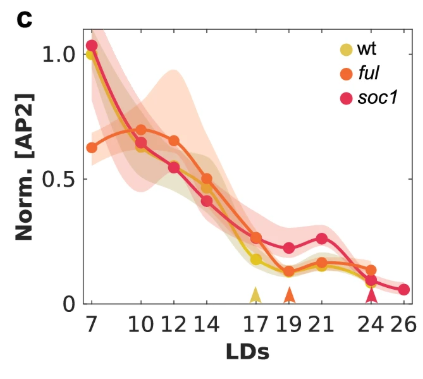
In the wild-type-like dynamics, AP2 is largely depleted by around 17LD. Complete depletion is delayed to about 19LD in @@INLINE0@@ and to 24LD in @@INLINE1@@.
More strikingly, after the initial decline in soc1, AP2 reduction nearly stops from 17 to 21LD, producing a clear plateau. Visible floral primordia do not appear until 24LD or later.
A model-independent analytical fit also showed that the bottleneck associated with critical slowing down lasted more than twice as long in soc1, while the minimum rate of AP2 decline was reduced by more than 50% relative to wild type.
Thus, the slowdown observed in the normal transition could be prolonged genetically.
Plants with a delayed developmental transition also showed a longer bottleneck in the molecular dynamics.
That is one of the strongest pieces of evidence in the paper.
Stronger perturbations reveal fluctuations in AP2
The soc1 ful double mutant showed an even more extreme phenotype. Complete AP2 depletion was delayed to 26LD, a long plateau extended from 17 to 24LD, and floral primordia were not observed until 29LD.
In both soc1 ful and an rAP2 line carrying an AP2 version resistant to miR172 regulation, AP2 abundance also showed early fluctuations.
The authors extended the model by incorporating delayed AP2 self-repression and were able to reproduce oscillatory behavior.
A boundary is important here: the physiological role of AP2 self-repression in generating these fluctuations has not been definitively established in vivo. It is best treated as a mechanistic hypothesis that allows the model to account for the observed dynamics.
The transition is spatial as well as temporal
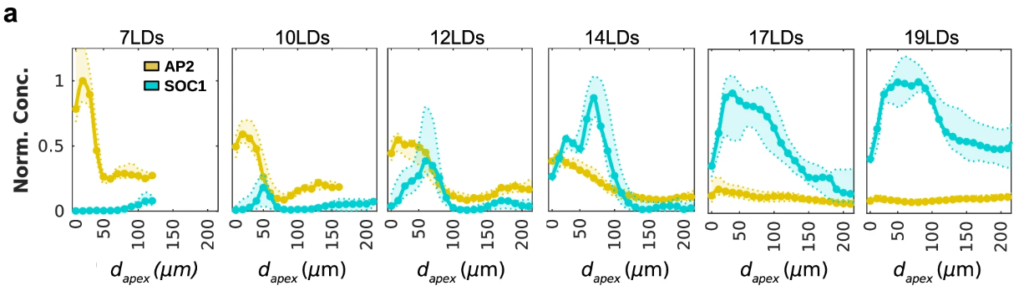
The paper also examined how AP2 and SOC1 are distributed within the SAM.
The horizontal axis d_apex represents distance along the meristem’s longitudinal axis from the apex.
At early stages, AP2 is strongest close to the apex, while SOC1 first emerges farther below. SOC1 then expands toward the apex, and a characteristic two-peaked SOC1 profile appears around 14LD.
It is important not to overinterpret this experimental panel. The data directly show spatial heterogeneity in AP2 and SOC1 expression; they do not by themselves prove that a developmental-state wave travels through the SAM.
The authors extended the model into the spatial dimension and showed that different meristem positions can, in principle, occupy distinct dynamical regimes.
This makes the floral transition more complex than a single switch flipping everywhere in the meristem at once.
What was observed, what is model-supported, and what remains unproven
Because the study integrates experiments and dynamical modeling so tightly, it is useful to separate direct observation from interpretation.
Direct experimental observations
- AP2 shows a fast–slow–fast decline during floral transition
- AP2 persistence and plateau duration increase in SOC1/FUL mutant backgrounds
- the AP2 plateau in
soc1correlates with delayed floral primordium development - AP2 and SOC1 show spatially heterogeneous expression across the SAM
Strongly supported by experiment–model comparison
- the AP2 versus SOC1/FUL circuit can behave as a time-dependent bistable switch
- a ghost attractor near a saddle-node bifurcation can generate critical slowing down and long transients
- a common dynamical framework can explain a range of delayed-flowering genotypes
Not yet directly demonstrated
- quantitative in vivo hysteresis in the floral-transition regulatory network
- the physiological importance of AP2 self-repression in producing the observed fluctuations
- direct live-imaging confirmation of distinct dynamical regimes at individual SAM positions
Bistable systems can exhibit hysteresis—a memory-like dependence on their previous state. Such a property could help explain why an SAM that has committed to inflorescence development does not easily revert to vegetative growth when environmental conditions deteriorate. But the authors explicitly note that quantitative perturbation experiments are still required to demonstrate hysteresis in this network.
“Making a flower” and “deciding what the flower contains” are different switches
The following point goes beyond the 2026 paper but is useful for understanding developmental hierarchy.
I have personally been involved in research on producing multi-petal flowers in cyclamen.
Cyclamen has two C-class genes related to the single Arabidopsis AGAMOUS (AG) gene: CpAG1 and CpAG2. Published work showed that CpAG1 functions mainly in stamen formation, whereas CpAG2 contributes more strongly to carpel formation and floral-meristem termination.
Suppressing CpAG1 function with a chimeric repressor converted stamens into petals, turning the normal five-petal cyclamen flower into a ten-petal flower. Strong simultaneous suppression of CpAG1 and CpAG2 produced rose-like flowers containing more than 40 petals and petaloid organs.
This is a different developmental layer from the AP2–SOC1/FUL transition studied in the 2026 paper.
The new Arabidopsis study asks whether a leaf-producing SAM becomes an inflorescence-producing SAM. The cyclamen work altered a later decision: what identities the floral organs acquire once a flower meristem has formed.
Within the single word “flowering” lie several distinct developmental decisions:
vegetative SAM → inflorescence SAM → floral meristem → floral-organ identity
The functional division between duplicated AG-like genes also varies among species. The cyclamen CpAG1/CpAG2 pattern should not be generalized into a universal rule that “AG1 controls stamens and AG2 controls carpels” across plants.
From lists of genes to developmental state transitions
Flowering research has accumulated long lists of promoters and repressors.
This study does not simply add another gene to that list.
Its contribution is to ask how an already known regulatory network behaves as a dynamical system over time.
If AP2 merely declined while SOC1/FUL rose, a simple ON/OFF description might have been sufficient. Instead, the transition temporarily slows, genetic perturbations extend the bottleneck, and expression is spatially heterogeneous across the SAM.
Plants are not literally “thinking” before they flower.
But when the developmental system passes a critical point, its dynamics really do slow down for a while.
Viewing plant development in terms of trajectories, rates and state transitions—rather than only which genes are ON or OFF—reveals a different way to understand how a meristem becomes committed to flowering.
References
Rodríguez-Maroto G, Wang K, Casanova-Ferrer P, et al. Time-dependent bistability leads to critical slowing down during floral transition in Arabidopsis. Nature Communications. 2026;17:8973. DOI: 10.1038/s41467-026-76210-2
Tanaka Y, Oshima Y, Yamamura T, et al. Multi-petal cyclamen flowers produced by AGAMOUS chimeric repressor expression. Scientific Reports. 2013;3:2641. DOI: 10.1038/srep02641
Figure license
Figures reproduced in this article from the 2026 paper are cropped selections from Rodríguez-Maroto et al., Nature Communications 17, 8973 (2026), published under the Creative Commons Attribution 4.0 International License (CC BY 4.0).


Comments